
Dividend Yield, Income and DRIP Compounding Explained
How yield is calculated, what a dividend really pays per quarter, how reinvesting compounds share count, and why yield on cost and dividend growth matter more than a high headline yield.
By Redbison Dev · · Updated · 10 min read
A dividend is a share of a company's profit paid out to its shareholders, usually in cash and usually on a fixed schedule. For an income investor, three questions come up again and again: what yield am I getting, how much money will actually arrive and when, and what happens if I reinvest it instead of spending it? This guide answers each with the arithmetic behind the Dividend Calculator, runs a 20-year example four ways, and is plain about the limits: dividends are paid at a board's discretion, so every projection is a scenario, not a promise.
Dividend yield: the starting formula
Dividend yield expresses the yearly dividend as a percentage of the share price:
dividend yield = annual dividend per share / share price x 100
A stock trading at $50 that pays $2.00 a year yields 2 / 50 = 4%. If you invest $10,000, you buy 200 shares and collect 200 x $2.00 = $400 a year. Paid quarterly, that is four payments of $100.
Two details change the answer more than people expect:
- Which dividend. A trailing yield uses the dividends actually paid over the last 12 months. A forward yield uses the current payment rate multiplied out over a year, for example the latest quarterly dividend times four. After a dividend increase, the forward yield is higher; after a cut, the trailing yield overstates what you will receive. The calculator lets you enter either a dividend per share or a yield, so use whichever figure you trust and know which kind it is.
- Which price. Yield moves inversely with price. If the $50 stock falls to $40 and the dividend stays at $2.00, the yield rises to 5%. Nothing about the income changed; the market simply values the shares lower. A very high yield is often a sign that the market expects a cut.
The inverse calculation is handy for planning. To collect a target income at a given yield:
investment needed = target annual income / (yield / 100)
$1,000 a month is $12,000 a year. At a 4% yield that needs $12,000 / 0.04 = $300,000 invested, before tax. The calculator's income goal box does this division for you.
When dividends are paid: the key dates
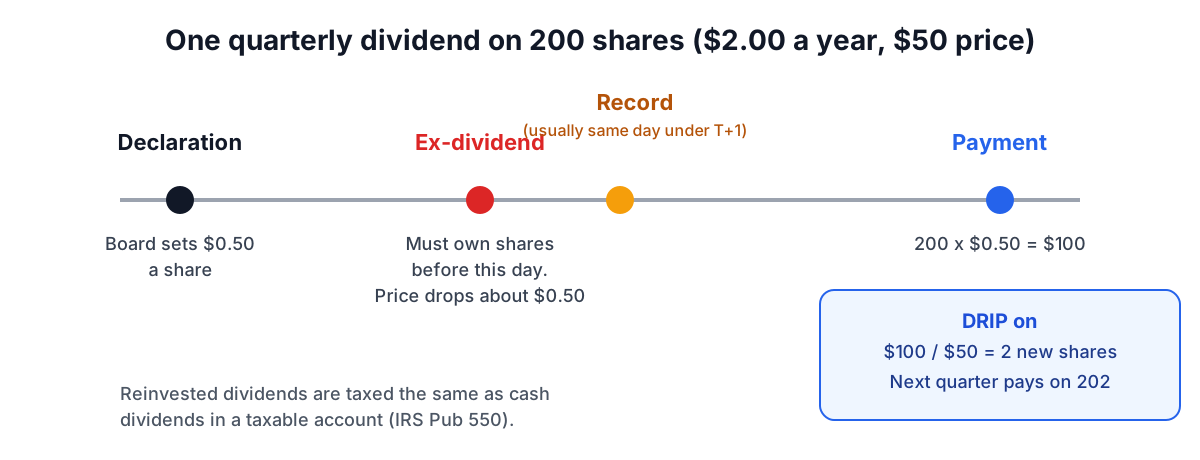
A company's board declares each dividend and sets several dates. The SEC's Investor.gov explains the sequence:
| Date | What it means |
|---|---|
| Declaration date | The board announces the amount and the other dates. |
| Ex-dividend date | You must own the shares before this date to receive the dividend. Buy on or after it and the seller gets it. |
| Record date | The company checks its records to see who the shareholders are. |
| Payment date | The cash arrives in your account. |
Since US stock trades moved to one-business-day settlement (T+1) in May 2024, the ex-dividend date is usually the same business day as the record date. On the ex-dividend date the share price typically drops by roughly the amount of the dividend, because the shares no longer carry it. That is why "buying the dividend" just before the ex-date does not create free money: you receive the cash but hold shares worth about that much less, and in a taxable account you now owe tax on the dividend.
DRIP: reinvesting dividends
A dividend reinvestment plan (DRIP) uses each dividend to buy more shares of the same stock or fund, usually including fractional shares. The new shares earn dividends of their own at the next payment, so share count compounds.
The calculator models this payment by payment:
- At each payment, dividend received = shares held x (annual dividend per share / payments per year), minus any tax rate you enter.
- With DRIP on, that amount buys shares at the price on the payment date. With DRIP off, it is held as cash.
- The price grows smoothly at your chosen yearly rate between payments.
- The dividend per share rises by your dividend growth rate at the start of each year.
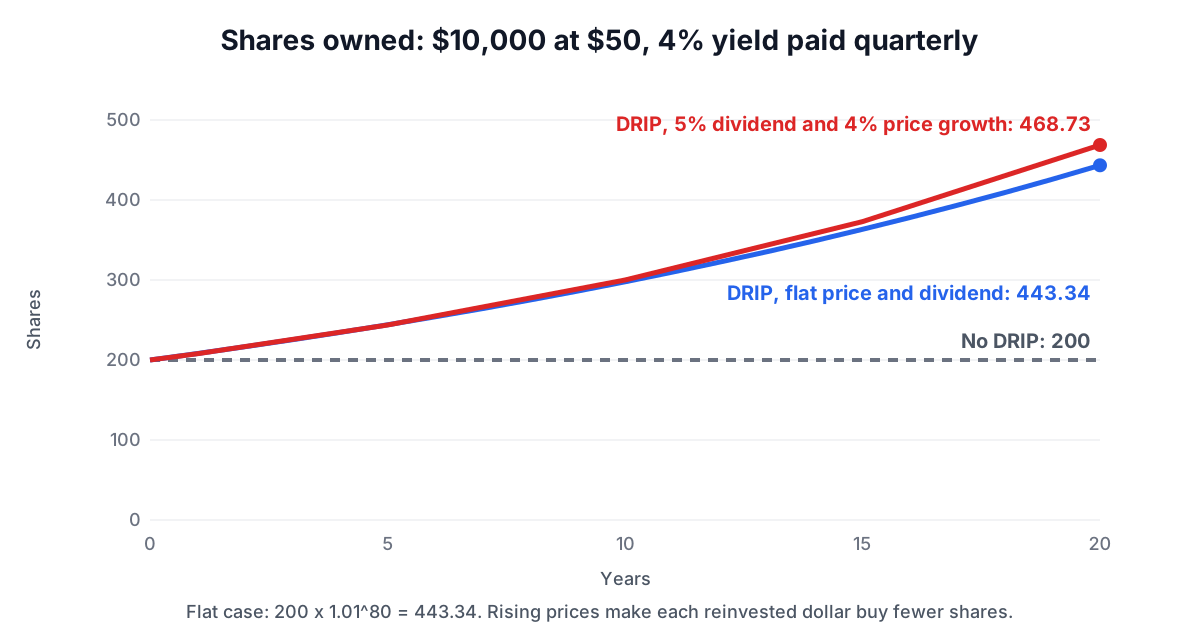
With a flat price and a flat dividend, reinvesting a 4% yield quarterly grows the share count by 1% each quarter. After 20 years (80 quarters) the 200 shares become 200 x 1.01^80 = 443.34 shares. The same test is in the calculator's regression suite, so you can check the arithmetic against a formula you can do on paper.
Four versions of the same 20 years
Start with $10,000 in a $50 stock paying $2.00 a year, quarterly, held for 20 years with no tax and no new money. Then vary two things: whether dividends are reinvested, and whether the business grows (5% a year dividend growth, 4% a year price growth).
| Scenario | Shares after 20 years | Total value | Income in the final year | Yield on cost |
|---|---|---|---|---|
| No growth, cash dividends | 200.00 | $18,000.00 | $400.00 | 4.00% |
| No growth, DRIP | 443.34 | $22,167.15 | $886.69 | 8.87% |
| 5% dividend and 4% price growth, cash | 200.00 | $35,137.61 | $1,061.32 | 10.61% |
| 5% dividend and 4% price growth, DRIP | 468.73 | $51,352.27 | $2,487.36 | 24.87% |
Total value includes cash dividends collected when DRIP is off. "Income in the final year" is the forward income: shares held at the end times the next year's dividend per share.
Several things stand out.
- Reinvesting matters more over time. With no growth at all, DRIP turns $8,000 of collected cash into an extra 243 shares and $4,167 more value, simply by putting the money to work as it arrives.
- Growth matters more than starting yield. The cash-only investor with a growing dividend ends with $1,061 a year of income, more than the flat-dividend DRIP investor's $887, without reinvesting a cent.
- The two together compound each other. With growth and DRIP, final-year income is $2,487, more than six times the starting $400.
- Rising prices slow DRIP share growth. With growth, the share count reaches 468.73 rather than higher, because each reinvested dividend buys fewer shares as the price climbs from $50 toward $109.56.
Yield on cost and why it can mislead
Yield on cost divides today's annual income by the total amount you invested:
yield on cost = current annual dividend income / total invested x 100
In the growth-plus-DRIP case, $2,487.36 of income on $10,000 invested is a 24.87% yield on cost. It is a satisfying number and a fair measure of how far the income stream has grown. It is not a measure of the investment's current return. The shares are now worth $51,352.27, and the yield on that market value is about 4.8%. When you decide whether to hold or sell, compare the current yield with alternatives, not your yield on cost.
Adding contributions and tax
Most investors keep adding money. Run the same growth scenario with $100 a month invested and a 15% tax on dividends before reinvestment:
- Total invested rises from $10,000 to $34,000.
- After 20 years you hold 934.51 shares worth $102,381.28.
- Dividends received over the period, after the 15% tax, total $33,522.00.
- Forward income is $4,959.06 a year.
The tax field exists because reinvested dividends are still taxable in a taxable account. IRS Publication 550 is explicit that dividends used to buy more shares under a reinvestment plan are reported as dividend income just as if you had received the cash. In an IRA or 401(k), enter 0%, because tax is deferred or, for Roth accounts, not due on qualified withdrawals.
For 2026, qualified dividends are taxed at the long-term capital gains rates of 0%, 15% or 20%, based on taxable income. Revenue Procedure 2025-32 sets the 2026 breakpoints:
| Filing status | 0% rate up to | 15% rate up to | 20% above |
|---|---|---|---|
| Single | $49,450 | $545,500 | $545,500 |
| Married filing jointly | $98,900 | $613,700 | $613,700 |
| Head of household | $66,200 | $579,600 | $579,600 |
| Married filing separately | $49,450 | $306,850 | $306,850 |
Ordinary (non-qualified) dividends, such as most REIT distributions and dividends on shares held for too short a time, are taxed at your regular income tax rate. To count as qualified, Publication 550 requires that you held the stock for more than 60 days during the 121-day period that begins 60 days before the ex-dividend date. Higher earners may also owe the 3.8% net investment income tax. A single flat percentage in the calculator is an approximation; use the rate that matches your bracket.
Limits of any dividend projection
- Dividends are not guaranteed. Boards cut or suspend dividends when profits fall, as many did in 2020. A 20-year projection at a steady 5% growth rate is an assumption, not a forecast.
- Prices are not smooth. The calculator grows the price at a constant rate. Real prices swing, and DRIP buys more shares when prices are low and fewer when high, so actual results differ in both directions.
- Concentration risk. Relying on one company's dividend for income ties your budget to one business. Funds spread that risk; the ETF fees and dividends guide covers what fund costs do to income.
- Fractional shares are assumed. Most brokers' DRIPs buy fractions; if yours only buys whole shares, the leftover cash sits uninvested until the next payment.
- Total return is what matters. A stock that pays 6% but loses 4% of its price each year has returned about 2%. For comparing investments on a total-return basis, use the CAGR Calculator or the Compound Interest Calculator.
Frequently asked questions
What is the ex-dividend date?
The ex-dividend date is the cutoff for a dividend: you must own the shares before that date to receive it, and if you buy on or after it the seller gets the payment. Since US trades moved to T+1 settlement in May 2024, the ex-dividend date is usually the same business day as the record date.
What is the difference between forward and trailing dividend yield?
A trailing dividend yield uses the dividends actually paid over the last 12 months, while a forward yield multiplies the current payment rate out over a year, such as the latest quarterly dividend times four. After a dividend increase the forward yield is higher, and after a cut the trailing yield overstates what you will receive.
What is the qualified dividend tax rate?
For 2026, qualified dividends are taxed at the long-term capital gains rates of 0%, 15% or 20%, based on taxable income. Under Revenue Procedure 2025-32, a single filer pays 0% up to $49,450 and 15% up to $545,500, while married couples filing jointly pay 0% up to $98,900 and 15% up to $613,700.
Does buying a stock just before the ex-dividend date make free money?
No. On the ex-dividend date the share price typically drops by roughly the amount of the dividend, because the shares no longer carry it. Buying just before the ex-date gets you the cash but leaves you holding shares worth about that much less, and in a taxable account you also owe tax on the dividend.
Is a high dividend yield a good sign?
Not necessarily. Yield moves inversely with price, so if a $50 stock paying $2.00 a year falls to $40, its yield rises from 4% to 5% without any change in income. A very high yield is often a sign that the market expects a dividend cut, and total return, not yield alone, is what matters.
Sources and further reading
- Ex-Dividend Dates: When Are You Entitled to Stock and Cash Dividends, US Securities and Exchange Commission.
- Publication 550, Investment Income and Expenses, Internal Revenue Service. Qualified dividends and reinvestment plans.
- Topic no. 404, Dividends and other corporate distributions, Internal Revenue Service.
- Revenue Procedure 2025-32, Internal Revenue Service. 2026 thresholds for the 0% and 15% rates.
- 26 US Code 1411: Imposition of tax, Legal Information Institute, Cornell Law School. The net investment income tax.
- SEC, final rule shortening the standard settlement cycle to T+1 (compliance date May 28, 2024).
- IRS Revenue Procedure 2025-32, section 4.03: maximum zero rate and 15 percent rate amounts for taxable years beginning in 2026.
More Calculators
Every tool in the Calculators section, free and in your browser.
- Investment Calculator
- Compound Interest Calculator
- Simple Interest Calculator
- Interest Calculator
- EMI Calculator
- Retirement Calculator
- Time-Weighted Return Calculator
- Savings Goal Calculator
- Inflation Calculator
- CAGR Calculator
- ROI Calculator
- Present and Future Value Calculator
- NPV and IRR Calculator
- 401(k) Calculator
- Roth IRA Calculator
- APY and CD Calculator
- SIP Calculator
- Annuity Calculator
- Bond Price and Yield Calculator
- Currency Converter
- Dividend Calculator
- Stock Average Calculator
- RMD Calculator