
How to Calculate a Weighted Average: Grades, GPA, Prices and Pitfalls
The weighted mean formula, why weights do not need to add to 100, the score you need on a final, average cost per share, and Simpson's paradox.
By Redbison Dev · · Updated · 8 min read
An ordinary average treats every number the same. Most real averages should not: a final exam worth 40% of a grade matters more than a quiz worth 5%, a four-credit course moves a GPA more than a one-credit lab, and 250 shares bought at one price matter more than 50 bought at another. A weighted average gives each value the influence it deserves. This article covers the formula, the common setups (grades, GPA, prices, ratings), how to work out the score you need on a final, and two traps that catch people who weight things incorrectly. The Weighted Average Calculator does every example below and shows each item's contribution.
The formula
weighted average = Σ(wᵢ × xᵢ) / Σwᵢ
Multiply each value xᵢ by its weight wᵢ, add the products, and divide by the sum of the weights. When every weight is 1, this is the ordinary mean.
A course with four categories:
| Category | Score | Weight | Score × weight |
|---|---|---|---|
| Homework | 92 | 20 | 1840 |
| Quizzes | 85 | 15 | 1275 |
| Midterm | 78 | 25 | 1950 |
| Final exam | 88 | 40 | 3520 |
| Total | 100 | 8585 |
The weighted average is 8585 / 100 = 85.85. The ordinary mean of the four scores is 85.75, close in this case only because the scores are similar. Change the final to 60 and the weighted average drops to 74.65 while the ordinary mean only falls to 78.75: the heavy weight on the final is doing its job.
Weights do not need to add to 100
Dividing by Σw makes the scale of the weights irrelevant. Weights of 20, 15, 25 and 40 give exactly the same answer as 0.20, 0.15, 0.25 and 0.40, or 4, 3, 5 and 8. Only the proportions matter. That is convenient: you can use credit hours, quantities or vote counts directly without converting them to percentages first.
It also explains what happens mid-term. If only homework, quizzes and the midterm are graded so far, their weights add to 60, and the weighted average of those three is (1840 + 1275 + 1950) / 60 = 84.42. That is your current standing on the work completed, which is what most gradebooks display.
Contribution: where the average comes from
Divide each product by the total weight and you get that item's contribution, the number of points it adds to the average:
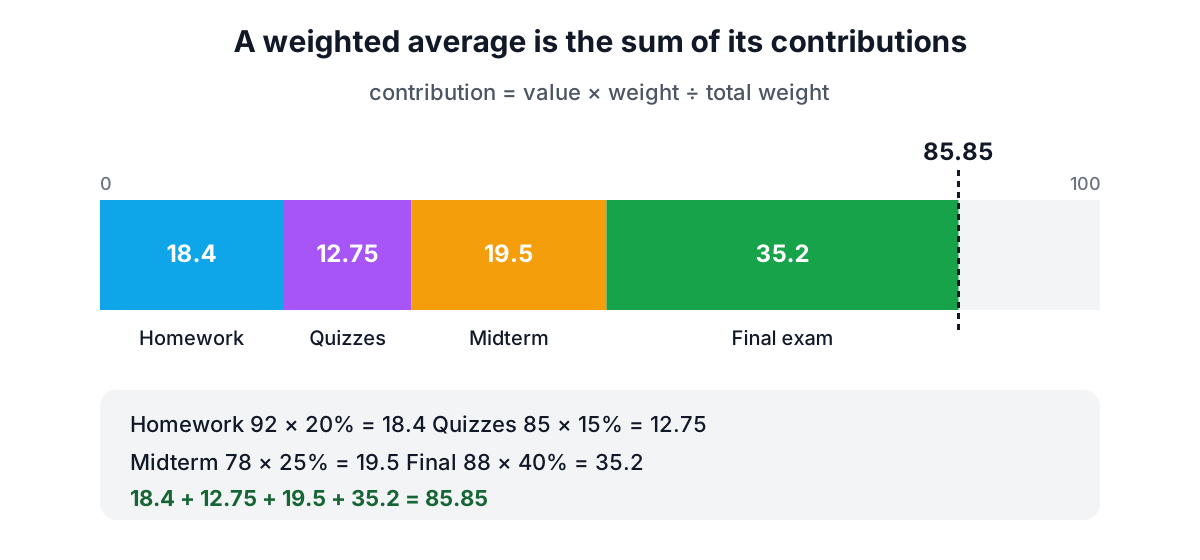
The final exam contributes 88 × 40 / 100 = 35.2 points, the midterm 19.5, homework 18.4 and quizzes 12.75. The contributions add to 85.85. Seeing them separately answers practical questions straight away: a 10-point improvement on the final adds 4 points to the course grade, while a 10-point improvement on quizzes adds only 1.5.
What do I need on the final?
Rearrange the formula to solve for one missing value. If you have points P = Σ(w × x) over weight W so far, and an item of weight w is still to come, the value x you need to finish with an average of T is:
x = (T × (W + w) − P) / w
Take scores of 90 (weight 20), 78 (weight 30) and 85 (weight 50), so P = 1800 + 2340 + 4250 = 8390 and W = 100. To reach a 90 average after a final with weight 25: x = (90 × 125 − 8390) / 25 = (11250 − 8390) / 25 = 114.4. The answer is above 100, which means the target is out of reach; the best possible average with a perfect 100 is (8390 + 2500) / 125 = 87.12. A negative answer would mean the target is already secured. The calculator's "What do I need?" box does this calculation, and the Final Grade Calculator is built around the same idea for a single course.
GPA: weighting by credit hours
A grade point average weights each course's grade points by its credit hours:
| Course | Grade | Points | Credits | Points × credits |
|---|---|---|---|---|
| Calculus | A | 4.0 | 4 | 16.0 |
| Chemistry | B+ | 3.3 | 4 | 13.2 |
| English | A− | 3.7 | 3 | 11.1 |
| PE | A | 4.0 | 1 | 4.0 |
| Total | 12 | 44.3 |
GPA = 44.3 / 12 = 3.6917 (exactly 443/120). The ordinary mean of the four grade points is 3.75, higher because it lets the one-credit PE course count as much as four-credit Chemistry. Point values for letter grades vary between schools (some give A+ a 4.3, some use 3.67 for A−), so use your institution's scale. The GPA Calculator handles letter grades and cumulative GPA.
Prices and costs: weighting by quantity
Buying the same share three times at different prices:
- 100 shares at $42.10 = $4,210.00
- 250 shares at $38.75 = $9,687.50
- 50 shares at $45.00 = $2,250.00
The average cost per share is the total spent divided by the shares owned: $16,147.50 / 400 = $40.36875. Averaging the three prices without weights gives $41.95, which overstates the cost because most shares were bought at the lowest price. The same applies to the weighted average unit cost of inventory bought in batches, to blended interest rates across loans of different sizes (weight by balance), and to fuel economy over trips of different lengths (weight by distance, or better, divide total distance by total fuel).
Ratings and surveys: weighting by count
A product with 120 five-star, 80 four-star, 30 three-star, 10 two-star and 15 one-star reviews has an average of
(5 × 120 + 4 × 80 + 3 × 30 + 2 × 10 + 1 × 15) / 255 = 1045 / 255 = 4.10
Here the values are the star levels and the weights are the counts. A frequency table is just a weighted average waiting to happen, and the Mean, Median and Mode Calculator gives the other summaries of the same data.
Two traps
Averaging averages
Two classes take the same test. Class A has 10 students with an average of 90; class B has 30 students with an average of 70. The overall average is not (90 + 70) / 2 = 80. Each class average must be weighted by its size: (10 × 90 + 30 × 70) / 40 = 75. Whenever you combine averages, percentages or rates from groups of different sizes, weight by the group size (or the denominator of the rate).
Simpson's paradox
Weighting can even reverse a comparison. In a well-known example from a 1986 study of kidney stone treatments, treatment A had a higher success rate than treatment B for small stones and for large stones separately, yet a lower success rate overall.
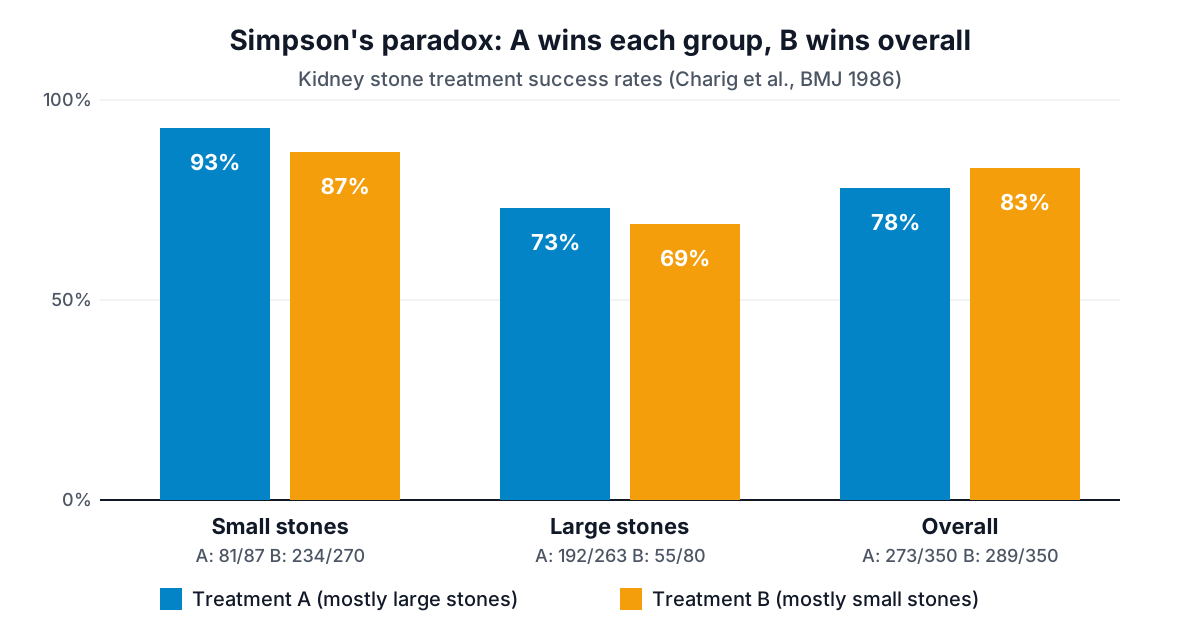
The reason is the weights. Treatment A was used mostly on large stones, which are harder to treat, and treatment B mostly on small ones. Each overall rate is a weighted average of the two group rates, and the weights are very different. The lesson for any weighted average: look at the weights as well as the values. The calculator shows each item's share of the weight next to its value for this reason.
Weighted average versus other averages
| Average | Use when |
|---|---|
| Arithmetic mean | Every value counts equally |
| Weighted mean | Values represent different amounts (credits, quantities, people) |
| Median | Outliers or skewed data would distort the mean |
| Geometric mean | Averaging growth rates or ratios, such as yearly returns |
| Harmonic mean | Averaging rates over equal amounts, such as speeds over equal distances |
The weighted mean is the right tool when the weights are real quantities. If you find yourself inventing weights to get a result you like, that is a sign you need a different summary, or a decision matrix where the weights are stated openly.
Checklist
- Identify what each value represents and choose weights that measure it (percentage, credits, quantity, count).
- Check that no weight is negative; a zero weight simply removes an item.
- Compute Σ(w × x) and Σw, then divide. Keep full precision until the end.
- Compare with the unweighted mean. A big difference tells you a few items dominate.
- When combining group averages, weight by group size.
Enter your own rows, or paste them from a spreadsheet, in the Weighted Average Calculator.
Frequently asked questions
How do I calculate average cost per share?
Divide the total spent by the number of shares owned. Buying 100 shares at $42.10, 250 at $38.75 and 50 at $45.00 costs $16,147.50 for 400 shares, an average cost of $40.36875 per share. Averaging the three prices without weights gives $41.95, which overstates the cost because most shares were bought at the lowest price.
How do I average percentages from groups of different sizes?
Weight each group's average or percentage by the size of the group instead of averaging them directly. A class of 10 students averaging 90 and a class of 30 averaging 70 have an overall average of (10 × 90 + 30 × 70) / 40 = 75, not 80. The same rule applies to combining any rates, weighting by group size or the rate's denominator.
What is Simpson's paradox?
Simpson's paradox is when weighting reverses a comparison. In a well-known 1986 study of kidney stone treatments, treatment A had a higher success rate than treatment B for small stones and for large stones separately, yet a lower success rate overall, because treatment A was used mostly on large stones, which are harder to treat, so the two overall rates used very different weights.
How do you calculate an average star rating?
Weight each star level by its number of reviews and divide by the total count. A product with 120 five-star, 80 four-star, 30 three-star, 10 two-star and 15 one-star reviews averages (5 × 120 + 4 × 80 + 3 × 30 + 2 × 10 + 1 × 15) / 255 = 1045 / 255 = 4.10 stars.
Sources and further reading
- NIST/SEMATECH e-Handbook of Statistical Methods: 1.3.5.1. Measures of Location, National Institute of Standards and Technology.
- Simpson's Paradox, Stanford Encyclopedia of Philosophy. How aggregated averages can reverse the trend of every group.
- Comparison of treatment of renal calculi by open surgery, percutaneous nephrolithotomy, and extracorporeal shockwave lithotripsy, The BMJ. Charig and colleagues, 1986, the kidney stone example of Simpson's paradox.
- Sex Bias in Graduate Admissions: Data from Berkeley, Science. Bickel and colleagues' 1975 classic example of Simpson's paradox.
Open the Weighted Average Calculator
More Math Calculators
Every tool in the Math Calculators section, free and in your browser.
- Percentage Calculator
- Fraction Calculator
- Ratio Calculator
- GCF and LCM Calculator
- Prime Factorization Calculator
- Quadratic Equation Solver
- Long Division Calculator
- Scientific Notation Calculator
- Number to Words Converter
- Roman Numeral Converter
- Percent Error Calculator
- Root Calculator
- Exponent Calculator
- Logarithm Calculator
- Rounding Calculator
- Weighted Average Calculator
- System of Equations Solver