
Time-Weighted vs Money-Weighted Return (TWR vs XIRR)
Two correct answers to "how did my investments do?". How TWR chains sub-period returns, how XIRR solves for a rate, and why they can disagree by tens of points.
By Redbison Dev · · Updated · 6 min read
Two people buy the same fund in January 2023 at 10 a unit. By July 2024 the unit price is 12. One of them earned about 0.8% a year. The other earned about 44% a year. Neither number is a mistake, and the fund's performance was identical for both: 20%.
The difference is entirely in when each person added money. This guide explains the two standard ways of measuring returns when money moves in and out, time-weighted return (TWR) and money-weighted return (MWR, usually computed as XIRR), how each is calculated, and which question each one answers. The worked numbers come from the Time-Weighted Return Calculator. They describe past performance; nothing here is a prediction or advice on what to buy.
The problem with simple return
If you invest once and never touch the account, return is easy: ending value divided by starting value, minus one. The trouble starts with the second deposit. Divide today's value by the total you put in and you get a "net return" that ignores how long each piece of money was invested. 1,000 that grew to 1,100 over a day and 1,000 that grew to 1,100 over ten years both show 10%.
There are two ways to fix this, and they deliberately measure different things.
Time-weighted return: how did the investment do?
TWR removes the effect of your deposits and withdrawals entirely. You split the history into sub-periods at every cash flow, measure the return of each sub-period on its own, and link them:
TWR = (1 + r1) × (1 + r2) × ... × (1 + rn) − 1

r(i) = value at end of sub-period / value at start of sub-period − 1
     (start value includes that day's deposit or withdrawal)
The linking has to be geometric. A fund that gains 50% and then loses 50% has not broken even: 100 becomes 150 and then 75, a 25% loss. Averaging the two sub-period returns would say 0%. The chaining is what makes TWR correct.
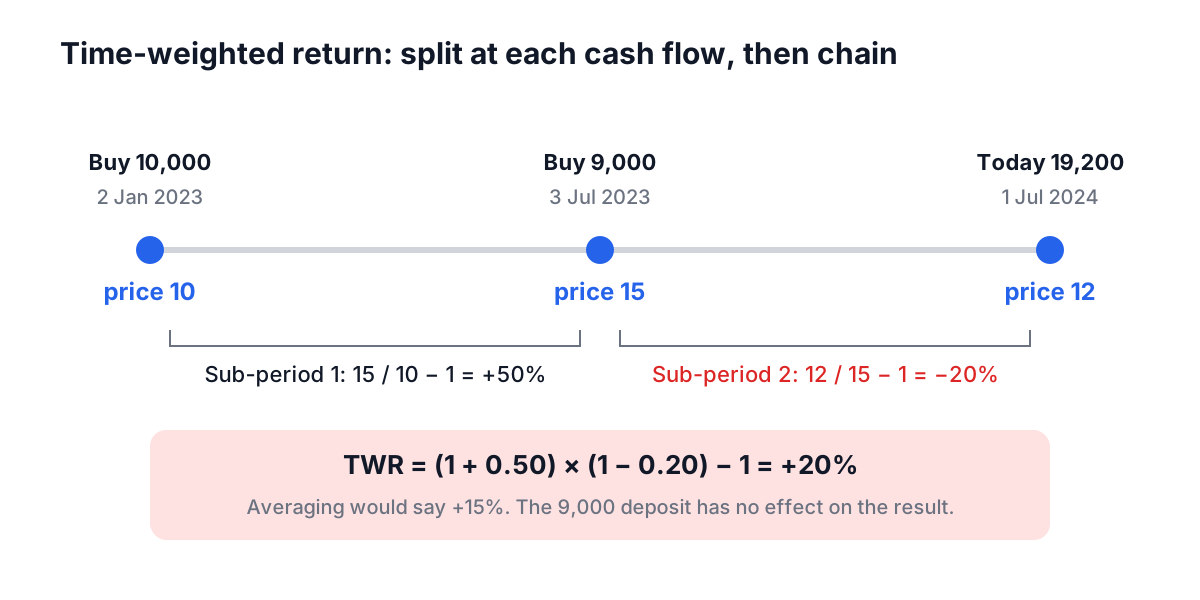
The catch is that you need the portfolio's value at the moment of every cash flow. For a single fund or share, the unit price gives you that, because the value per unit does not depend on how many units you hold. That is how the calculator works: when every transaction has a share count, it takes each price (from Price per Share, or amount divided by shares), adds today's price as current value divided by shares held, and chains the ratios. If any transaction lacks shares, it shows n/a rather than guessing.
Because each sub-period is measured independently, TWR is the same for everyone who held the fund over the same dates, whatever they deposited. That is why fund managers report it and why the GIPS performance standards use it as the default for comparing managers. A manager does not control when clients add money, so they should not be judged on it.
Money-weighted return: how did your money do?
MWR answers the personal question. It is the internal rate of return of your actual cash flows: the single annual rate at which everything you put in, everything you took out, and today's value balance to a net present value of zero.
0 = Σ  CF(k) / (1 + rate)^(days(k) / 365)

CF = −amount for each buy, +amount for each sell,
     +current value on today's date
There is no closed-form solution, so it is solved numerically. Spreadsheet XIRR uses actual days divided by 365, and so does this calculator, which uses Newton's method with a bisection fallback. You can check it against the reference example in Excel's documentation: −10,000 on 1 January 2008 followed by inflows of 2,750, 4,250, 3,250 and 2,750 gives 37.34%.
Because a bigger balance gets more weight, MWR rewards adding money before good periods and penalises adding it before bad ones. That is exactly what you want to know about your own decisions, and exactly what you do not want when judging a fund.
The same fund, three investors
All three hold one fund priced at 10 on 2 January 2023, 15 or 8 in July 2023 depending on the scenario, and 12 on 1 July 2024.
| Investor | Cash flows | TWR | Net return | XIRR (annual) |
|---|---|---|---|---|
| A: adds at the top | Buy 10,000 at 10; buy 9,000 at 15; now 1,600 units | +20.0% | +1.1% | +0.8% |
| B: adds at the bottom | Buy 1,000 at 10; buy 8,000 at 8; now 1,100 units | +20.0% | +46.7% | +43.7% |
| C: sells at the top | Buy 10,000 at 10; sell 500 units for 7,500 at 15; now 500 units | +20.0% | n/a | +39.5% |
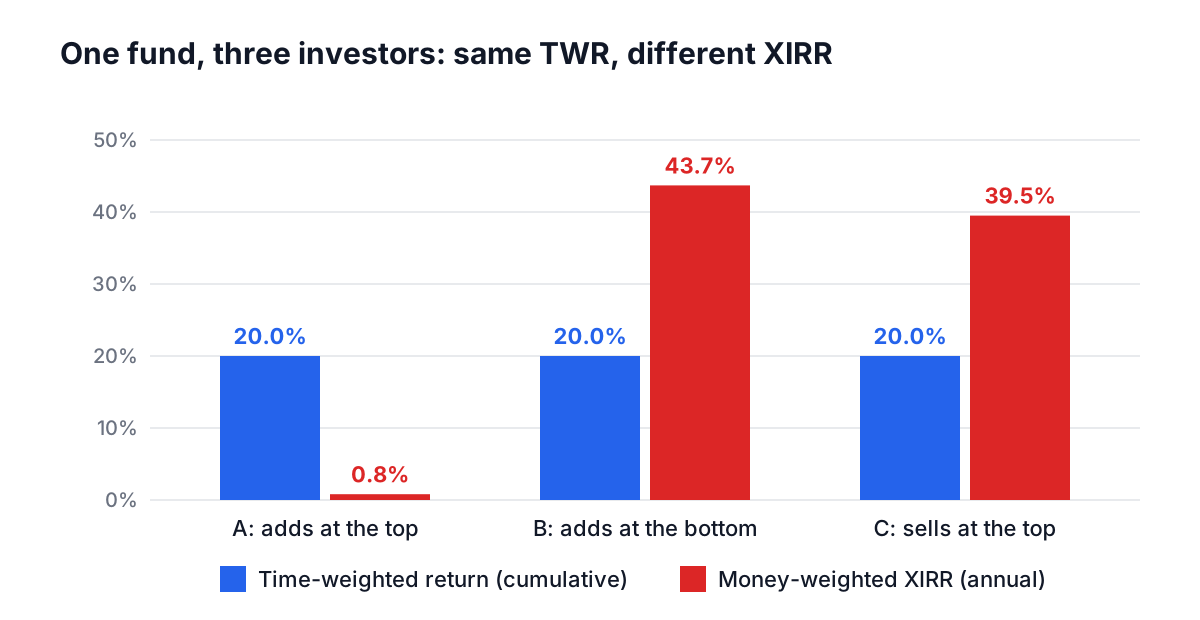
TWR is identical, 20%, because the fund went from 10 to 12 for all of them (investor B's path ran 10 to 8 to 12, which also chains to 0.8 × 1.5 = 1.2). Their money-weighted results are wildly different because their timing was. Investor A's large second purchase landed just before a 20% fall. Investor B put most of the money in at the low. Investor C took money out at the high. Investor C's net return is not meaningful, because more money came out than the net amount still invested; this is one reason net return is a weak measure.
The 20% TWR is over about 1.5 years. Annualized, it is 1.2^(1 / 1.496) − 1, about 13.0% a year. Remember to annualize before comparing a TWR with an XIRR, which is already annual.
Using the calculator
- Clear the sample data, then add each purchase and sale under Add Transaction with its date, amount and number of shares. Add the price per share if your statement shows it; otherwise it is derived from amount / shares.
- Enter today's total value of the holding in Current Value.
- Read the four results: Total Returns with net percentage, Net Investment, Time-Weighted Return and Money-Weighted Return (XIRR, annualized).
- Compare TWR with the fund's published return for the same dates. They should be close, apart from dividends and fees.
- Compare your XIRR with the TWR. The gap is the effect of your timing.
Transactions are stored in your browser's localStorage, not on a server, so they are still there when you return on the same device.
Why your XIRR differs from the fund's reported return
Fund factsheets publish a time-weighted return, because the manager controls the investments but not when investors buy or sell. Your XIRR is money-weighted, so it reflects your own deposits and withdrawals. If you added most of your money shortly before a fall, your XIRR lands below the published figure even though you held exactly the same fund. If you added heavily after a drop, it can land above it. The gap is not an error in either number; it is the effect of your timing, and the calculator shows both side by side so you can see its size.
Common mistakes
- Averaging sub-period returns. Always chain them.
- Comparing a cumulative TWR with an annual XIRR. Annualize first.
- Using TWR for a whole portfolio of different holdings without valuations. Unit prices of one fund cannot value a mixed portfolio. For that you need the total portfolio value on every cash-flow date.
- Reading a short-period XIRR literally. A 5% gain in two months annualizes to over 30%. Short periods produce extreme annual rates.
- Forgetting dividends. Cash dividends paid out are a return that this method misses. Accumulating share classes avoid the problem.
What to take away
Use TWR to judge an investment or a manager, and XIRR to judge your own results. When they diverge, the gap is information, not an error: a persistently lower XIRR usually means money has been added after strong runs. If you invest monthly, the SIP vs lump sum guide explains why steady contributions are less exposed to that pattern, and the Investment Calculator projects where a regular plan could lead. For individual positions, the Stock Analysis Calculator covers the per-trade view.
Frequently asked questions
Why do fund managers report time-weighted return?
Fund managers report time-weighted return because it removes the effect of investors' deposits and withdrawals, which the manager does not control. Each sub-period is measured on its own, so TWR is the same for everyone who held the fund over the same dates. That is why the GIPS performance standards use it as the default for comparing managers.
How is XIRR calculated?
XIRR is the internal rate of return of your actual cash flows: the single annual rate at which every buy, every sale and today's value balance to a net present value of zero, using actual days divided by 365. There is no closed-form solution, so it is solved numerically. Excel's reference example of -10,000 followed by four inflows gives 37.34%.
Why can't you average sub-period returns?
Averaging sub-period returns gives the wrong answer because returns compound, so they must be chained geometrically. A fund that gains 50% and then loses 50% turns 100 into 150 and then 75, a 25% loss, while the simple average of the two returns says 0%. Time-weighted return multiplies (1 + r) for each sub-period and subtracts one.
How do I compare a time-weighted return with XIRR?
Annualize the time-weighted return first, because a cumulative TWR covers the whole holding period while XIRR is already an annual rate. For example, a 20% TWR earned over about 1.5 years annualizes to 1.2^(1 / 1.496) − 1, about 13.0% a year. Only then does the gap between the two show the effect of your timing.
Why is my XIRR so high over a short period?
XIRR annualizes the return, and short periods produce extreme annual rates. A 5% gain over two months annualizes to more than 30% a year, even though the money has only grown by 5%. Read a short-period XIRR as an annual rate the investment would reach only if that pace continued, not as what you actually earned.
Sources and further reading
- GIPS Standards for Firms, CFA Institute.
- 2020 GIPS Standards for Firms, CFA Institute. Full text, with the rules on time-weighted and money-weighted returns.
- XIRR function, Microsoft Support. The actual-days / 365 convention.
- 6.7 Investments, OpenStax. Return on investment for stocks, bonds and funds.
Open the Time-Weighted Return Calculator
More Calculators
Every tool in the Calculators section, free and in your browser.
- Investment Calculator
- Compound Interest Calculator
- Simple Interest Calculator
- Interest Calculator
- EMI Calculator
- Retirement Calculator
- Time-Weighted Return Calculator
- Savings Goal Calculator
- Inflation Calculator
- CAGR Calculator
- ROI Calculator
- Present and Future Value Calculator
- NPV and IRR Calculator
- 401(k) Calculator
- Roth IRA Calculator
- APY and CD Calculator
- SIP Calculator
- Annuity Calculator
- Bond Price and Yield Calculator
- Currency Converter
- Dividend Calculator
- Stock Average Calculator
- RMD Calculator