
Lump Sum vs Dollar Cost Averaging: Australian Figures
Invest $100,000 now or over 6 to 12 months? The maths in Australian dollars, what cash earns while you wait, FCS cover, and where regular ETF investing fits.
By Redbison Dev · · 6 min read
Australia edition. Written for Australian investors: the Indian SIP idea as regular ETF investing or dollar cost averaging, amounts in AUD, the RBA cash rate and Financial Claims Scheme cover for money waiting to be invested. US edition
Invest $100,000 in a diversified ETF today and, at a steady 7% a year, it is worth $196,715.14 in ten years. Feed it in over six months and it is worth $194,092.34; over twelve months, $190,968.04. In a market that rises steadily, every month of waiting costs money, and Vanguard's study of rolling one-year periods, which included the S&P/ASX 300 from 1992 to 2022, found a lump sum beat cost averaging in 61.6% to 73.7% of periods depending on the market. That is the average. Whether it is the right answer for your inheritance, bonus or property sale depends on something the average cannot measure: how you would react to a fall straight after you invest.
In India this is "SIP versus lump sum". In Australia the monthly version is usually called dollar cost averaging, or simply a regular investment plan into an ETF or managed fund. All the projections here come from the Australian investment calculator. They are arithmetic at a steady return, not a recommendation of any product or platform.
How the calculator works out each option
Regular investing treats each monthly amount as invested at the start of the month and compounds monthly, the future value of an annuity due:
FV = P × [((1 + i)^n − 1) / i] × (1 + i)
with P the monthly amount, i the yearly return divided by 12 and n the number of months. $500 a month for 20 years at 7% gives $261,982.70 from $120,000 invested; at 5% it gives $206,373.15.
A lump sum compounds once a year: value = amount × (1 + rate)^(months / 12). $20,000 for ten years at 6% gives $35,816.95.
To model phasing a lump sum, run the monthly amount over the phasing months, then grow the result as a lump sum for the rest of the term. Because the calculator compounds regular amounts monthly and lump sums yearly, this slightly flatters phasing, so the real cost of waiting is a little larger than shown.
$100,000 now or over time
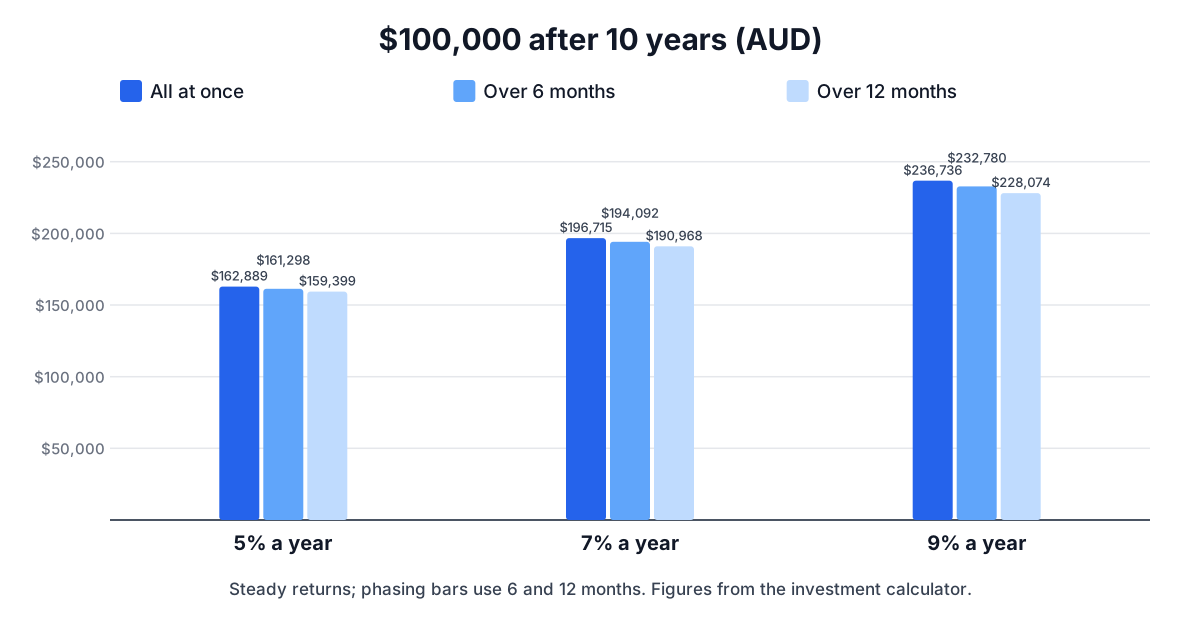
| Steady return | All at once | Over 3 months | Over 6 months | Over 12 months |
|---|---|---|---|---|
| 5% a year | $162,889.46 | $162,259.36 | $161,298.23 | $159,399.20 |
| 7% a year | $196,715.14 | $195,681.05 | $194,092.34 | $190,968.04 |
| 9% a year | $236,736.37 | $235,183.34 | $232,779.53 | $228,074.01 |
At 7%, phasing over three months gives up $1,034.09, six months $2,622.80 and twelve months $5,747.10. The higher the return you expect, the more phasing costs, because money sitting out of the market misses more growth. Vanguard's study makes the same point from history: the longer it takes to invest fully, the more often the lump sum comes out ahead.
On a smaller amount the gap is smaller in dollars but similar in proportion. $20,000 invested at once at 6% for ten years is $35,816.95; phased over twelve months it is $34,908.13, $908.82 less.
The cash you hold while phasing
The table assumes money waiting to be invested earns nothing. In practice it can sit in a high-interest savings account or a term deposit, and that narrows the gap. The Reserve Bank's cash rate target was 4.85% after the increase that took effect on 4 November 2026. Check what your bank actually pays on savings or a short term deposit: a six-month phase-in of a large sum earns that interest along the way. Interest is taxable income, so the after-tax figure is what to compare.
That cash is also protected while it waits. The Financial Claims Scheme covers deposits up to $250,000 for each account holder at each authorised bank, building society or credit union, including savings accounts, term deposits and separate offset accounts. A sale or inheritance larger than that can be split across banks. The scheme protects deposit accounts only (transaction, savings and cheque accounts, term deposits and separate offset accounts), so money moved into ETFs or shares is outside it.
Why some people still phase in
The steady-return model hides the one case phasing protects against: a sharp fall soon after you invest. If $100,000 goes in and the market falls 20% in the first quarter, the whole sum takes the loss. Someone phasing over twelve months would have most of the money still in cash and would buy units at lower prices. In the periods Vanguard did not count as lump-sum wins, cost averaging came out ahead, and an early fall is the situation where that happens. Nobody knows in advance which kind of year they are in.
Regular investing also lowers your average cost per unit whenever prices move around:
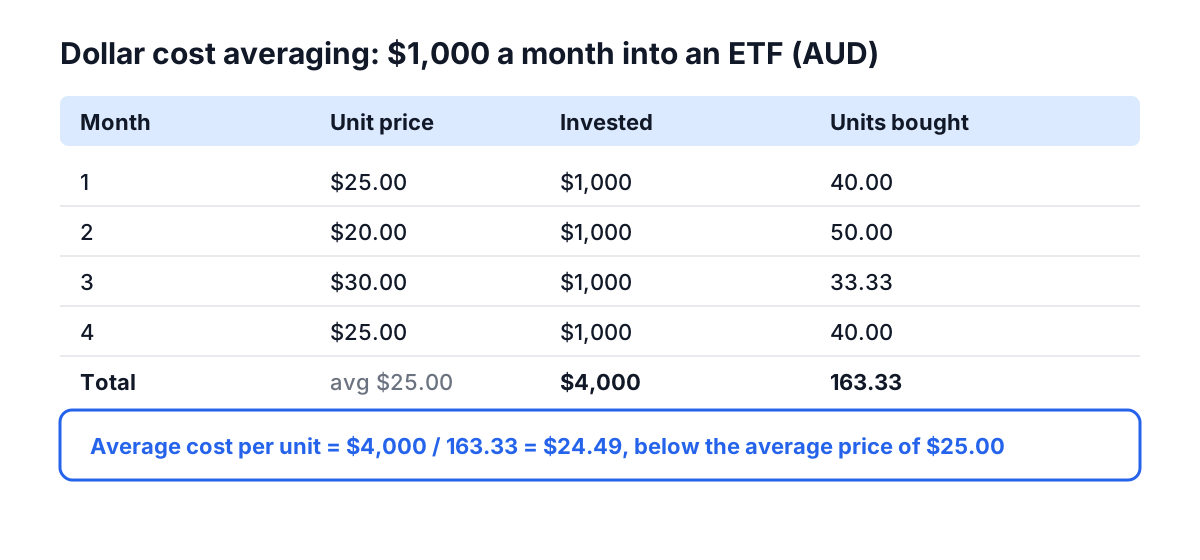
The average cost ($24.49) is below the average price ($25.00) because the cost is the harmonic mean of the prices. The effect is real but modest, and it does nothing in a market that only goes up.
So phasing is a trade: a lower expected result in exchange for less regret if markets fall early. If an early fall would make you sell and lock in the loss, phasing over three to six months is the better plan for you, even though it is not the better average.
Regular investing from your pay
For most Australians the question never comes up as a lump sum. Money arrives with each pay, and a regular amount into an ETF or managed fund is simply what you can afford. Your employer's super contributions work the same way: they are invested with each pay cycle, which is dollar cost averaging by default.
Two practical points apply to small regular purchases:
- Brokerage. ETFs are bought and sold through a licensed intermediary such as an online broker or platform, as the ASX guide to ETFs explains. If a broker charges a flat fee per trade, say $5 as an example, that is 1% of a $500 purchase but 0.05% of $10,000. Buying less often, or using a platform priced for small amounts, can matter more than the timing question.
- Management fees. The ASX notes that each fund's product disclosure statement lists its fees and costs. Enter a return after fees: on $500 a month over 20 years, the gap between 7% and 5% is $55,609.55.
A practical way to decide
- Money from your pay: invest it regularly. Use the calculator to size the amount for your goal and test 5%, 7% and 9%.
- A windfall for a goal at least 5 to 10 years away: the average favours investing it now. If a fall soon after would make you sell, phase it over three to six months and keep the waiting cash in a covered deposit.
- Money needed in the next few years: keep it in cash or a term deposit rather than shares.
- Inside or outside super: money outside super stays accessible but its earnings are taxed each year; super is taxed at concessional rates but preserved. Contribution caps apply to lump sums into super, so check the ATO's current caps before making one.
The compound interest guide for Australia covers the growth formula behind both modes, and the US edition of this guide has the same maths without Australian rules. If the sum is large or your tax position is complicated, a licensed financial adviser can look at it with your super and other assets.
Frequently asked questions
Is it better to invest a lump sum or dollar cost average in Australia?
On average, investing at once has done better: Vanguard's study, which covered the S&P/ASX 300 from 1992 to 2022, found a lump sum ahead in 61.6% to 73.7% of rolling one-year periods depending on the market. Dollar cost averaging does better when markets fall soon after you start, and it mainly reduces regret.
How long should I take to invest $100,000?
There is no rule, but the cost of waiting grows with the period. At a steady 7% over ten years, phasing over three months gave up $1,034.09, six months $2,622.80 and twelve months $5,747.10, before counting the interest the waiting cash earns.
Is money waiting to be invested safe in a bank account?
Deposits at an authorised bank, building society or credit union are covered by the Financial Claims Scheme up to $250,000 per account holder at each institution. Shares and ETFs are not deposits and are not covered.
Does dollar cost averaging lower my average purchase price?
When prices move around, yes. Four $1,000 purchases at $25, $20, $30 and $25 buy 163.33 units at an average cost of $24.49, below the average price of $25.00. In a market that rises every month it makes no difference.
Does brokerage change the answer for small monthly investments?
It can. A flat fee per trade is a much larger share of a small purchase than a large one, so check your broker's pricing and the fund's fees in its product disclosure statement before setting up a small monthly plan.
Sources and further reading
- Cash rate target, Reserve Bank of Australia. 4.85% from 4 November 2026.
- Financial Claims Scheme: banks, building societies and credit unions, APRA. $250,000 per account holder per institution.
- Investing in exchange traded products, ASX. Buying through a licensed intermediary, distributions and fees in the PDS.
- The truth about cost averaging, Vanguard. Lump sum against cost averaging, rolling one-year periods, including the S&P/ASX 300.
- 6.6 Methods of Savings, OpenStax. Future value of regular deposits.
- 6.4 Compound Interest, OpenStax. Growth of a single lump sum.
Open the Investment Calculator
More Calculators
Every tool in the Calculators section, free and in your browser.
- Investment Calculator
- Compound Interest Calculator
- Simple Interest Calculator
- Interest Calculator
- EMI Calculator
- Retirement Calculator
- Time-Weighted Return Calculator
- Savings Goal Calculator
- Inflation Calculator
- CAGR Calculator
- ROI Calculator
- Present and Future Value Calculator
- NPV and IRR Calculator
- 401(k) Calculator
- Roth IRA Calculator
- APY and CD Calculator
- SIP Calculator
- Annuity Calculator
- Bond Price and Yield Calculator
- Currency Converter
- Dividend Calculator
- Stock Average Calculator
- RMD Calculator